FDOT District Six Data-driven Bicycle & Pedestrian Facility Needs Prioritization Tool (BPTool)
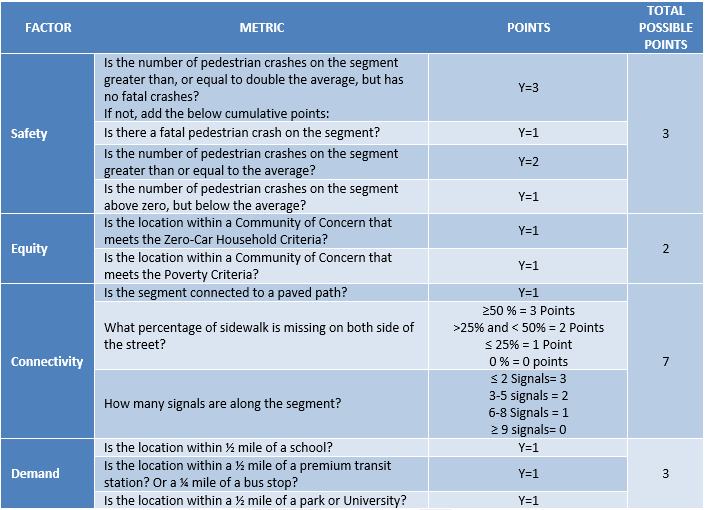
The following table describes the prioritization metrics for the pedestrian segments:
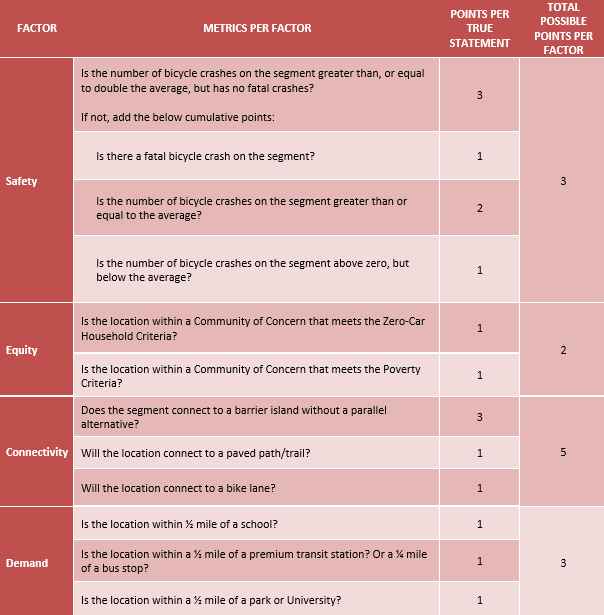
The following table describes the prioritization metrics for the bicycle segments:
Download Options
1) Select Data Type:
2) Select Data Scope
User Example #1
I want to identify project opportunities where the pedestrian and bicycle demand is the highest.
Steps:
Using the left-side margin, select the Pedestrian feature.
For the Demand criterion, slide the “Low” button all the way to “High”. Keep the other criterion to
account for the entire range of low to high.
Repeat Steps 1 and 2, but select the Bicycle feature in the left-side margin.
User Example #2
Safety funding is available. What segments were identified as having the greatest need from a safety
standpoint?
Steps:
Using the left-side margin, select the Pedestrian feature.
For the Safety criterion, slide the “Low” button all the way to “High”. Keep the other criterion to
account for the entire range of low to high.
Repeat Steps 1 and 2, but select the Bicycle feature in the left-side margin.
User Example #3
I have an upcoming RRR project in the Work Program and would like pedestrian and bicycle related
information for scoping purposes.
Steps:
Select the Pedestrian feature in the left-side margin.
Using the map, find the RRR project segment in question. Making sure all criteria are showing low to
high data, use your curser to click the RRR segment. A pop-up box will appear summarizing the
results and score for the segment in question. The table below the map also summarizes the
prioritization results.
Use the download button in the top right corner and select “download selected area” to obtain the
data and results in excel, PDF or GIS form.
Repeat Steps 1 through 3, but select the Bicycle feature in the left-side margin.
OPTIONAL: You may type in the facility name in the “Search” feature of the table below the map.
User Example #4
A concerned citizen called stating unsafe conditions for pedestrians due to lack of crossings along A1A.
You would like to quickly obtain data and the priority ranking of A1A to help inform your response.
Steps:
Using the left-side margin, select the Pedestrian feature.
Using the “Search” feature in the table, type in “A1A”.
Sort the “Connectivity” column from highest to lowest by clicking the column title until the highest
number is at the top of the list.
Use the download button in the top right corner and select “download selected area” to obtain the
data and results in excel, PDF or GIS form.
OPTIONAL: Use the map to locate the facility in question rather than the “Search” tool.
User Example #5
A concerned citizen called stating unsafe conditions for bicycling along Sunset Drive.
Steps:
Using the left-side margin, select the Bicycle feature.
Using the “Search” feature in the table, type in “Sunset”.
Use the download button in the top right corner and select “download selected area” to obtain the
data and results in excel, PDF or GIS form.
OPTIONAL: Use the map to locate the facility in question rather than the “Search” tool.
Segment Priority - Overall Ranking:
Low
High
Local Parks
Tri-Rail Stations
Bus Stops
National Parks
Metrorail Stations
Colleges & Universities
Equity Areas
help_outline
Equity Focus Areas
These areas consists of those with a high proportion of zero car and/or low income
households. Referred to as "Communities of Concern" in the Miami-Dade TPO’s Federal
Planning Emphasis Areas (PEAs) for Miami-Dade County report (November 2017).
Metromover Stations
Public Schools
Data-driven Prioritization Metrics
Use the slider bars below to adjust the individual criterion influence on the overall ranking
scores. Click here for examples.
Segment Filters
The inputs below may be used to identify segments that have a certain percentage of missing sidewalk.
BPTool ID#
Roadway
Name
Context Classification
Mode
Begin MP
End MP
# Fatalities
# Crashes
Safety Points
Sidewalk Gap %
Connectivity Points
Demand Points
Equity Points
Total Score
BPTool ID#
Roadway
Name
Context Classification
Mode
Begin MP
End MP
# Fatalities
# Crashes
Safety Points
Bike Facility
Paved Path
Parallel Corridor
Connectivity Points
Demand Points
Equity Points
Total Score
Data Inputs & Sources
Data Sources
Connectivity: For facility data - FDOT’s Roadway Characteristics Inventory (RCI) database (2018); For signal data - Miami-Dade County GIS Online Portal (2018).
Demand: Miami-Dade County GIS Online Portal (2018).
Equity: Communities of Concern by census block, Miami-Dade TPO’s Federal Planning Emphasis Areas (PEAs) for Miami-Dade County report (November 2017).
Safety: FDOT CARS Database (2014-2018).
Value of BPTool
Project Development
Districtwide, project managers can view a SHS facility/segment priority level for
bicyclist and pedestrian needs within a study area. Project managers can also view
the related safety, equity, demand and connectivity data within the same study area.
Value of BPTool
Performance Management
The tool may be used to develop a baseline for the District by quantifying the
performance of the various measures by individual SHS corridors, for subareas, or
Districtwide. The data should be updated routinely to then track progress and assess
if changes are needed in order to achieve the ultimate goal of zero deaths.
The Bicycle & Pedestrian Facility Needs Prioritization Tool (BPTool) was created to communicate and
highlight
State Highway System bicycle and pedestrian priority areas in an objective, data-driven manner
using safety, equity, demand, and connectivity performance measures.
The Florida Department of Transportation (FDOT), District Six is proactively seeking ways to support
and advance safety initiatives for the State Highway System’s (SHS) most vulnerable users,
bicyclists and pedestrians. One strategy developed to advance this initiative is the District Six
Bicycle & Pedestrian Facility Needs Prioritization Tool (BPTool). The BPTool was created by the
Planning and Environmental Management Office to communicate and highlight SHS bicycle and pedestrian
priority areas in an objective, data-driven manner using safety, equity, demand, and connectivity
measures. A system-wide tool such as this also creates consistency, encourages collaboration, and
provides immediate opportunities to improve the system in an organized, prioritized manner.
Tiffany Gehrke
Bicycle/Pedestrian Coordinator & ADA
Coordinator
phone(305) 470-5308Office
emailTiffany.Gehrke@dot.state.fl.usWork
domainPlanning & Environmental Management OfficeFlorida Department of Transportation, District Six
The Bicycle & Pedestrian Facility Needs Prioritization Tool (BPTool) was created to communicate and
highlight
State Highway System bicycle and pedestrian priority areas in an objective, data-driven manner
using safety, equity, demand, and connectivity performance measures.
The Florida Department of Transportation (FDOT), District Six is proactively seeking ways to support
and advance safety initiatives for the State Highway System’s (SHS) most vulnerable users,
bicyclists and pedestrians. One strategy developed to advance this initiative is the District Six
Bicycle & Pedestrian Facility Needs Prioritization Tool (BPTool). The BPTool was created by the
Planning and Environmental Management Office to communicate and highlight SHS bicycle and pedestrian
priority areas in an objective, data-driven manner using safety, equity, demand, and connectivity
measures. A system-wide tool such as this also creates consistency, encourages collaboration, and
provides immediate opportunities to improve the system in an organized, prioritized manner.